Theory of the Gravity Stress Program
(Gravity Point)
Theory By: Douglas L. Wardle Sr.
Original: 11 January 2006
Version 3: 30 July 2007
It has long been known that gravity plays a part in the occurrence of volcanic eruptions and quakes on planets and moons. Gravity is the cause of our oceanic tides. The Earth’s crust is also moving due to the influence of gravity, just not in the same way as the ocean water. By analyzing the effects of gravity, an arbitrary numeric range can be established to indicate the level of stress on the Earth’s surface that is caused by gravity. The number can then be used to set the percentage of gravitational stress. Perhaps that percentage can be a useful tool, in a collection of tools, that will lead to the forecasting of earthquakes and volcanic eruptions.
A measurement of the force of gravity is basically the same at high tides, as it is at low tides. Likewise, a measurement of gravity on land will not yield useable information. Although, there are sensitive instruments that can detect subtle changes in the force of gravity, the information is not useful for this purpose. However, note how the tides move in relation to the Moon and Sun. Other objects in the solar system also have an influence, but the influence of other planets is so small as to not be worth further consideration at this time. As the Earth rotates under the Sun and Moon, water flows in the oceans to provide the observed high and low tides. The oceans are pulled into an egg shape, with the highest levels, on opposite sides of the earth, and in line with the Moon and Sun. The crust of the earth also tends to move, and does not flow as the water does.
Consider the moon’s influence only, as it causes the surface of the earth to rise when it its over head, or on the other side of the earth. At the same time, it is causing the surface of the earth that is at 90 degrees from the direction of the moon to be lower than normal.
The Moons effect on the Earth
The crust of the Earth, like an egg shell, is floating on magma and has fractured forming the tectonic plates. The surface of the earth that is in line with the moon (there is a slight lag due to the earth’s rotation) is simply moving up and is not under the stress of being bent. At 90 degrees from the center line to the moon, the earth’s surface is being drawn down, in order to accommodate the change in shape of the earth’s crust. Therefore, the greatest downward pressure occurs at right angles to the direction of the moon, and also the sun. However, 90 degrees is not where the greatest amount of bending of the earth’s surface takes place. Like an arch or domed building, the pressure is spread out over the surface of the earth in a circle. Though the study of the frequency of earthquakes, it has been learned that two high stress rings of stress exist at 30 degrees and 60 degrees to the centerline of the gravitational influence. The amount of gravitation pull dose not effect the size of the gravitational stress circles. It is on the circles that the greatest amount of crustal bending, or stress, is taking place on the earth’s surface. Other factors, such as the earth’s rotation and its reaction to the stress also affect the resulting stress pattern.
Notice, that due to the rotation of the earth, the polar radius is shorter than the equatorial radius. As described earlier, that polar flattening of the earth is also encouraged by the gravitational influence of the moon and sun. The result is that the polar areas have a very small amount of geological activity. Earthquake observations show that activity seems to be higher between 25 to 35 degrees and 55 to 65 degrees latitude. As the earth rotates, the edge of the stress circles pass over a spot in an hours time. At the northern and southern edges of the stress circles, the edges of the stress circles can take as much as four hours to pass over a spot. That is the part of the earth that receives the greatest amount of flexing by the gravitational forces. It would seem that since the Moon exerts an average of 2.17 more gravitational stress than the Sun, its ring of high stress would be bigger. However, that is not true. The rings of high stress is a function of the size and shape of the Earth, and not the strength of the force of gravity. That function causes not one but two concentric high stress circles to be formed, a pair on opposite sides of the Earth. From the centerline to the Moon or Sun, a high stress ring forms at 30 degrees, and at 60 degrees. The Sun moves north and south through the seasons and year. The Moon moves north and south through the lunar month. The Moon comes close and moves away during perigee and apogee. Therefore, the amount of stress is constantly changing. When the edges of the two stress circle happen to fall on the same spot on earth, the stress is very high.
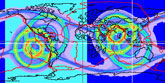
50% Gravity Stress Magnitude 3.9 6 August 2007
Coal Mine Collapsed. Location: 39.465 N. 111.237 W.
21 km ( 13 mi) E S E of Mount Pleasant, Utah, USA
Click on image to enlarge
By developing an indicator number that is related the angular position of the moon and sun, and their relative gravitational strength, it is possible to create a measurement of the stress in the earth’s crust, and like the barometer in weather forecasting, it can be used to help forecast possible future geological activity. The moon exerts an average of 2.17 times more gravitational force on the earth than the sun. By creating a number that represents the maximum amount of stress caused by the Sun and Moon together, a (GP) stress percentage can be calculated.
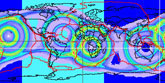
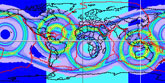
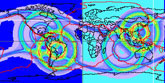
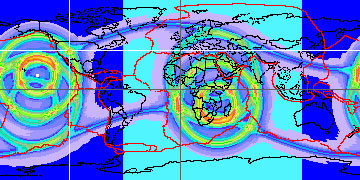
A false collar map of the earth can then be made to show the waves of gravitational stress as they pass over the surface of the earth. There are identical patterns of stress on the apposite sides of the earth. Therefore, the same spot on earth gets hit with almost a twin set of stress waves twice a day. These stress waves set the stage for earthquake and volcanic activity. Avery high stress wave can pass over a fault one day and yet have relatively nothing happen. Yet on another day a lesser stress wave can be the one to finally trigger an earthquake. There are certainly many other elements involved than just gravitational stress.
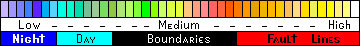
The Gravity Point collar scale
As the collar scale shows, black is used to show land and some national boundaries. Red shows the main tectonic plate fault lines. Light and dark blue show where the Sun is by day or night. Then there is a collar scale that represents the percentage of stress. As yet, accuracy is only at one degree. So each pixel on the map represents one degree by one degree on the world map. There are three elements on the false collar map that is not explained by the collar scale. There is a white four pixel dot that appears in the center of one circle. That is where the moon is directly above the earth. There are two crossed gray lines that show the equator and the Universal Time lime. There are two crossed white lines that show a particular gravity point of interest, and gives a numeric readout of information in the Gravity Point program.
The data for the observations made in this theory was collected from the following web site:
USGS Earthquake Hazards Program
http://earthquake.usgs.gov/recenteqsww/Quakes/quakes_all.html.
|